

As an experienced trader, you understand that decoding market sentiment is key to making informed decisions. While fancy indicators have their place, sometimes the simplest tools are the most powerful. Therefore, that’s where candlestick patterns come in. These visual signals, formed by the open, high, low, and close prices over a specific period, offer a unique glimpse into the psychology of market participants and can signal potential price movements.
Learning to identify key candlestick patterns is like learning the market’s secret language. For instance, they can provide early warnings of potential reversals or confirmations of existing trends. In this guide, consequently, we’ll break down the top 10 candlestick patterns that every serious trader should have in their arsenal, explaining what they look like and what they might be telling you about the market.
Understanding the Basics of Candlestick Patterns
Before diving into the specific patterns, let’s quickly recap what a single candlestick represents:
- The Body: The thick part of the candle shows the range between the open and close prices.
- A green or white body typically means the close was higher than the open (bullish).
- Conversely, a red or black body typically means the close was lower than the open (bearish).
- The Wicks (or Shadows): The thin lines extending above and below the body.
- The upper wick shows the highest price reached during the period. 1 1. beforeitsnews.com beforeitsnews.com
- Similarly, the lower wick shows the lowest price reached during the period.
Ultimately, the size and proportion of the body and wicks tell a story about the trading activity and the strength of buyers versus sellers during that period.
Why Candlestick Patterns Matter in Trading
So, why focus on candlestick patterns? Firstly, they provide a quick, visual summary of price action. Secondly, they reflect the battle between buyers and sellers. Furthermore, certain patterns can signal potential trend reversals or continuations before other indicators. Finally, they are a fundamental tool in technical analysis used by traders globally.
Ready to learn the patterns that can give you an edge? Now, let’s look at the top 10 candlestick patterns.
The Top 10 Candlestick Patterns Every Trader Needs to Know
Here are 10 crucial candlestick patterns and what they suggest about potential market moves. However, remember that patterns are most effective when confirmed by other indicators or context.
Decoding Key Reversal and Continuation Candlestick Patterns
We’ve selected a mix of patterns that signal potential trend changes and some that indicate continuation or indecision, all vital for understanding market dynamics.
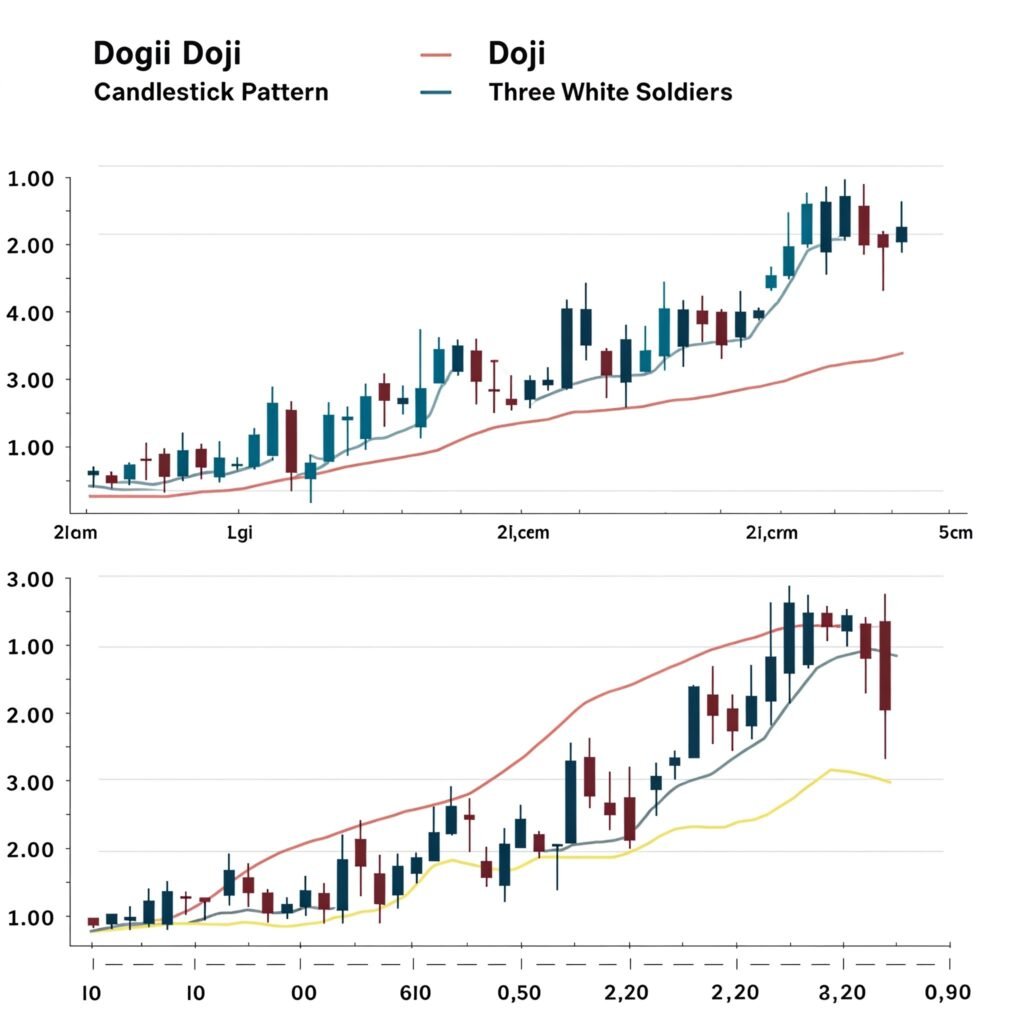
- Doji: What This Candlestick Pattern Tells You
- Appearance: Looks like a cross or plus sign. The open and close prices are very close, consequently, resulting in a tiny or non-existent body. Wicks can be short or long.
- Significance: Indicates indecision or a stalemate between buyers and sellers.
- Context/Actionable Takeaway: A Doji after a strong trend might suggest exhaustion and potential reversal. On the other hand, a Doji within a range often indicates continued consolidation.
- [Image Placeholder: Doji Candlestick Pattern]
- Hammer: What This Candlestick Pattern Tells You
- Appearance: Small body at the top of the candle, with a long lower wick at least twice the length of the body. Notably, it appears after a downtrend. The body can be bullish (green/white) or bearish (red/black), although bullish is slightly stronger.
- Significance: Bullish reversal pattern. Sellers pushed the price down, but buyers stepped in strongly to close near the high.
- Context/Actionable Takeaway: Often found at potential support levels. Suggests buying pressure is returning. Therefore, look for confirmation on the next candle (a higher close).
- [Image Placeholder: Hammer Candlestick Pattern]
[Outbound Link: Investopedia - Hammer Pattern]
- Hanging Man: What This Candlestick Pattern Tells You
- Appearance: Looks identical to a Hammer, however, it appears after an uptrend. Small body at the top, long lower wick. Body can be bullish or bearish.
- Significance: Bearish reversal pattern. Buyers tried to push the price up, yet sellers drove it back down significantly.
- Context/Actionable Takeaway: Found at potential resistance levels. Suggests selling pressure is increasing. Consequently, warrants caution; look for bearish confirmation on the next candle (a lower close).
- [Image Placeholder: Hanging Man Candlestick Pattern]
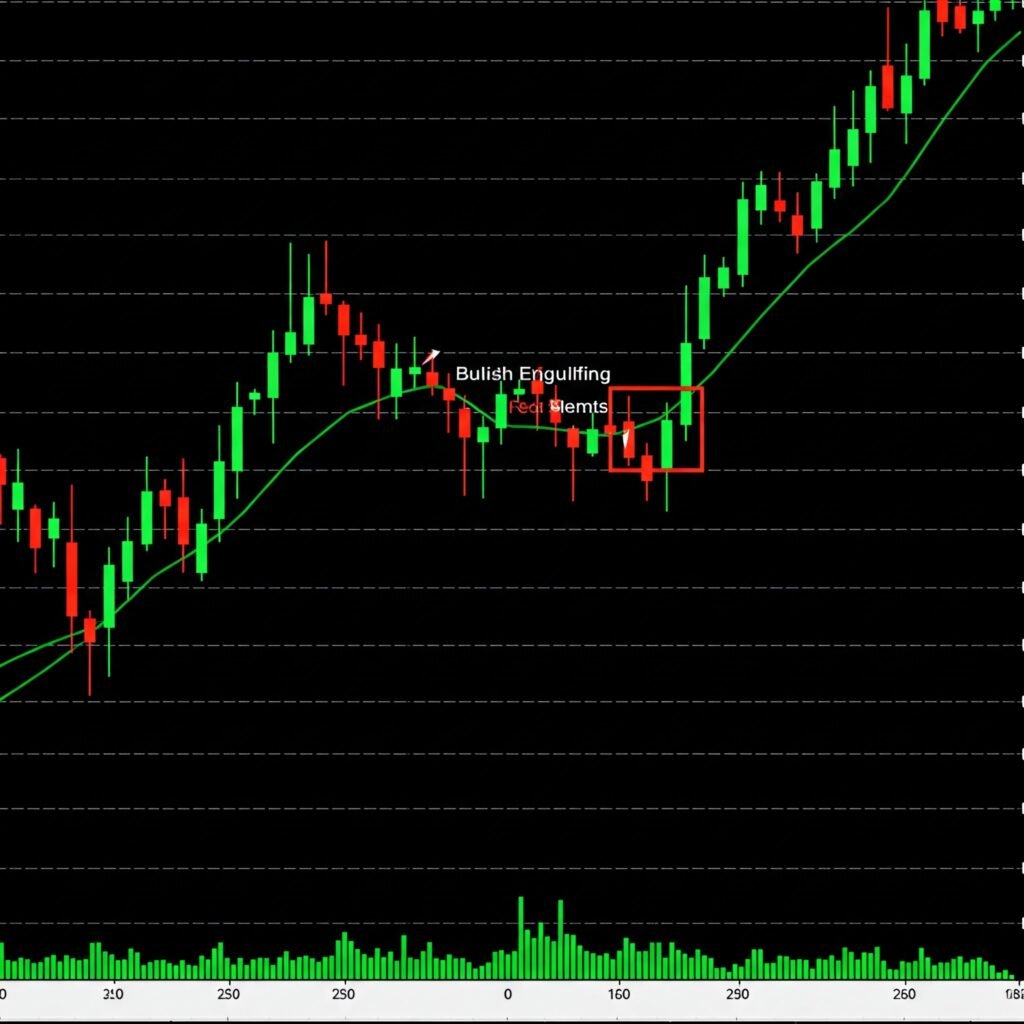
- Bullish Engulfing: What This Candlestick Pattern Tells You
- Appearance: A two-candle pattern. First, the candle is a small bearish (red/black) candle. Second, it’s followed by a larger bullish (green/white) candle whose body completely engulfs the body of the previous bearish candle.
- Significance: Strong bullish reversal pattern, typically found at the end of a downtrend.
- Context/Actionable Takeaway: Shows a significant shift in momentum as buyers overpower sellers. Moreover, a higher volume on the bullish candle adds conviction.
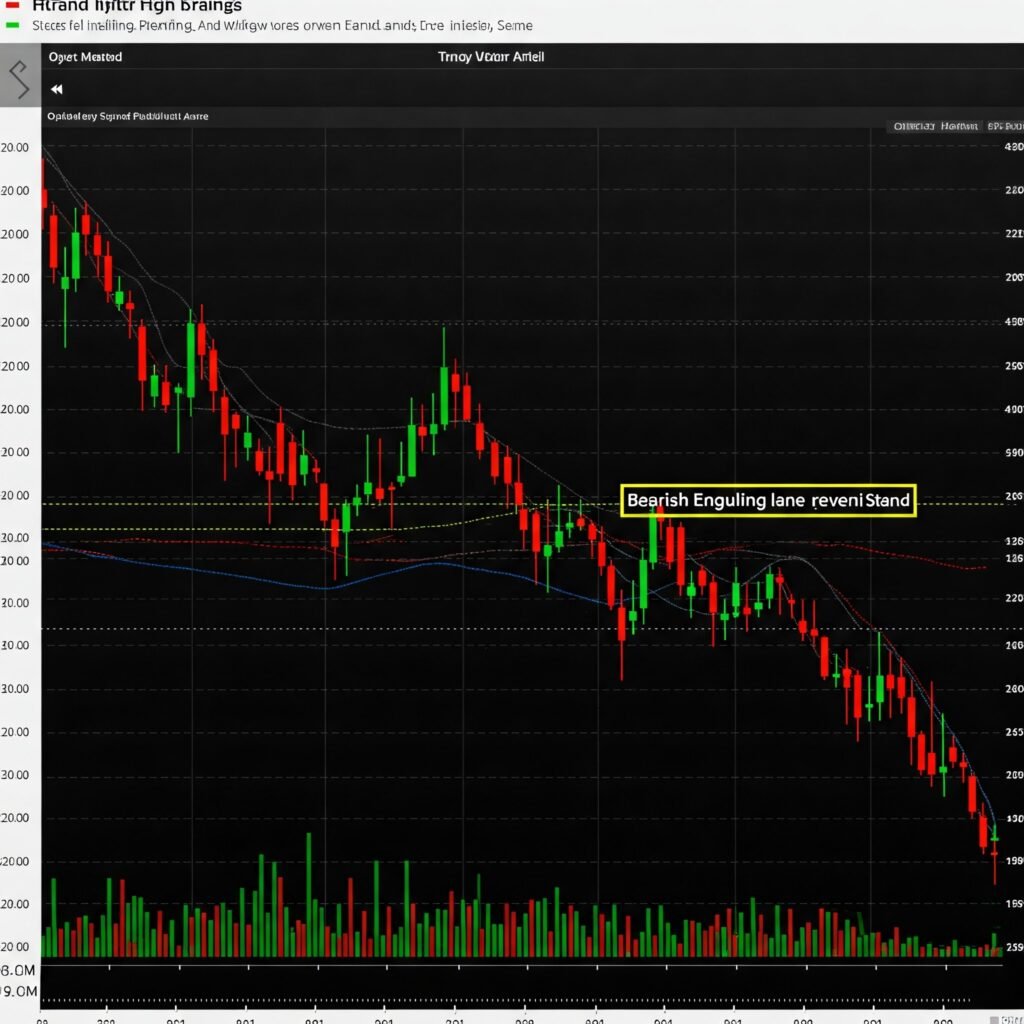
- Bearish Engulfing: What This Candlestick Pattern Tells You
- Appearance: A two-candle pattern, the opposite of the Bullish Engulfing. Initially, the first candle is a small bullish (green/white) candle, followed by a larger bearish (red/black) candle whose body completely engulfs the body of the previous bullish candle.
- Significance: Strong bearish reversal pattern, typically found at the end of an uptrend.
- Context/Actionable Takeaway: Shows sellers taking control from buyers. Again, a higher volume on the bearish candle adds conviction.
- [Image Placeholder: Bearish Engulfing Candlestick Pattern]
- Morning Star: What This Candlestick Pattern Tells You
- Appearance: A three-candle bullish reversal pattern, often found at the end of a downtrend.
- Candle 1: A long bearish (red/black) candle.
- Candle 2: A small-bodied candle (could be Doji, Hammer, or a small body) that gaps lower than the first candle. It can be bullish or bearish. This is the “star.”
- Candle 3: A long bullish (green/white) candle that closes well into the body of the first bearish candle, ideally above its midpoint.
- Significance: Indicates a shift from bearish to bullish momentum.
- Context/Actionable Takeaway: Represents waning selling pressure (Candle 1), followed by indecision (Candle 2), and then returning buying pressure (Candle 3). A strong signal when confirmed.
- [Image Placeholder: Morning Star Candlestick Pattern]
- Appearance: A three-candle bullish reversal pattern, often found at the end of a downtrend.
- Evening Star: What This Candlestick Pattern Tells You
- Appearance: A three-candle bearish reversal pattern, often found at the end of an uptrend. Simply put, it’s the opposite of the Morning Star.
- Candle 1: A long bullish (green/white) candle.
- Candle 2: A small-bodied candle that gaps higher than the first candle. This is the “star.”
- Candle 3: A long bearish (red/black) candle that closes well into the body of the first bullish candle, ideally below its midpoint.
- Significance: Indicates a shift from bullish to bearish momentum.
- Context/Actionable Takeaway: Represents waning buying pressure (Candle 1), followed by indecision (Candle 2), and then returning selling pressure (Candle 3). A strong signal when confirmed.
- [Image Placeholder: Evening Star Candlestick Pattern]
- Appearance: A three-candle bearish reversal pattern, often found at the end of an uptrend. Simply put, it’s the opposite of the Morning Star.
- Piercing Line: What This Candlestick Pattern Tells You
- Appearance: A two-candle bullish reversal pattern, found after a downtrend.
- Candle 1: A long bearish (red/black) candle.
- Candle 2: A long bullish (green/white) candle that opens below the low of the first candle (a gap down) but closes above the midpoint of the first bearish candle’s body.
- Significance: Shows buyers stepping in aggressively after an initial sell-off.
- Context/Actionable Takeaway: Stronger signal if the bullish candle closes deeper into the bearish candle’s body. As always, look for confirmation.
- Appearance: A two-candle bullish reversal pattern, found after a downtrend.
- Dark Cloud Cover: What This Candlestick Pattern Tells You
- Appearance: A two-candle bearish reversal pattern, found after an uptrend. Conversely, it’s the opposite of the Piercing Line.
- Candle 1: A long bullish (green/white) candle.
- Candle 2: A long bearish (red/black) candle that opens above the high of the first candle (a gap up) but closes below the midpoint of the first bullish candle’s body.
- Significance: Shows sellers stepping in aggressively after an initial push higher.
- Context/Actionable Takeaway: Stronger signal if the bearish candle closes deeper into the bullish candle’s body. Indicates a potential top.
- [Image Placeholder: Dark Cloud Cover Candlestick Pattern]
- Appearance: A two-candle bearish reversal pattern, found after an uptrend. Conversely, it’s the opposite of the Piercing Line.
- Three White Soldiers: What This Candlestick Pattern Tells You
- Appearance: A three-candle bullish continuation or reversal pattern, typically found after a downtrend or period of consolidation.
- Three consecutive long bullish (green/white) candles.
- Each candle opens within the body of the previous candle.
- Each candle closes progressively higher, near its high, with short or no upper wicks.
- Significance: Strong bullish signal indicating sustained buying pressure.
- Context/Actionable Takeaway: Shows buyers are firmly in control. Thus, can indicate the start of a new uptrend or the continuation of an existing one after a pause.
- Appearance: A three-candle bullish continuation or reversal pattern, typically found after a downtrend or period of consolidation.
How to Use Candlestick Patterns Effectively
Simply spotting a pattern isn’t enough. Instead, here’s how to make candlestick patterns work for you:
Combining Candlestick Patterns with Other Indicators
Candlestick patterns are most reliable when used in conjunction with other technical analysis tools. For example, consider looking for patterns that appear:
- Near significant support or resistance levels.
- Coinciding with bullish or bearish signals from indicators like moving averages, RSI, or MACD.
- Confirmed by increasing volume (especially for engulfing patterns).
Practice and Patience: Mastering Candlestick Patterns
Like any trading skill, identifying and interpreting candlestick patterns takes practice.
- Start by observing them on historical charts.
- Next, practice identifying the top 10 candlestick patterns in real-time using a demo account before trading with real money.
- Finally, be patient and wait for confirmation from subsequent price action or other indicators.
Beyond the Basics: Advanced Tips for Candlestick Pattern Analysis
- Context is King: A Hammer in the middle of a choppy market means little; conversely, a Hammer at the bottom of a clear downtrend is significant. Always consider the price action leading up to the pattern.
- Confirmation is Crucial: Never trade solely on a pattern. Rather, wait for the next candle to confirm the suggested move.
- Timeframe Matters: Patterns on longer timeframes (daily, weekly) are generally more reliable than those on shorter timeframes (intraday). Therefore, choose a timeframe that aligns with your trading style.
Your Next Steps in Mastering Candlestick Patterns
You’ve now got a solid foundation in the top 10 candlestick patterns that can significantly enhance your technical analysis skills. Understanding these patterns is a crucial step in learning to read the market’s story.
Why not start practicing today? Open your charting software and begin identifying these powerful candlestick patterns. With practice and patience, you’ll become more adept at spotting potential opportunities and risks they signal.


